
After a bit of deliberation, we decided to go with the idea of persuading WPI students who are not computer science majors to learn programming and apply their knowledge to their specific field.
Although I was a bit sad to let go of the idea of automation in white collar jobs and the role of artificial intelligence and machine learning in that trend, I realized that it might be a bit too difficult to effectively research and explain in a single page information graphic. Creating an effective narrative would also be significantly more challenging since, with the exception of Brandon, none of us have any specific job experience in the field outside of school. However, the topic that we did chose had some elements of the automation idea, in that we decided to include applications of computer science on the various majors, and how they might be able to effectively leverage artificial intelligence and machine learning in their fields.
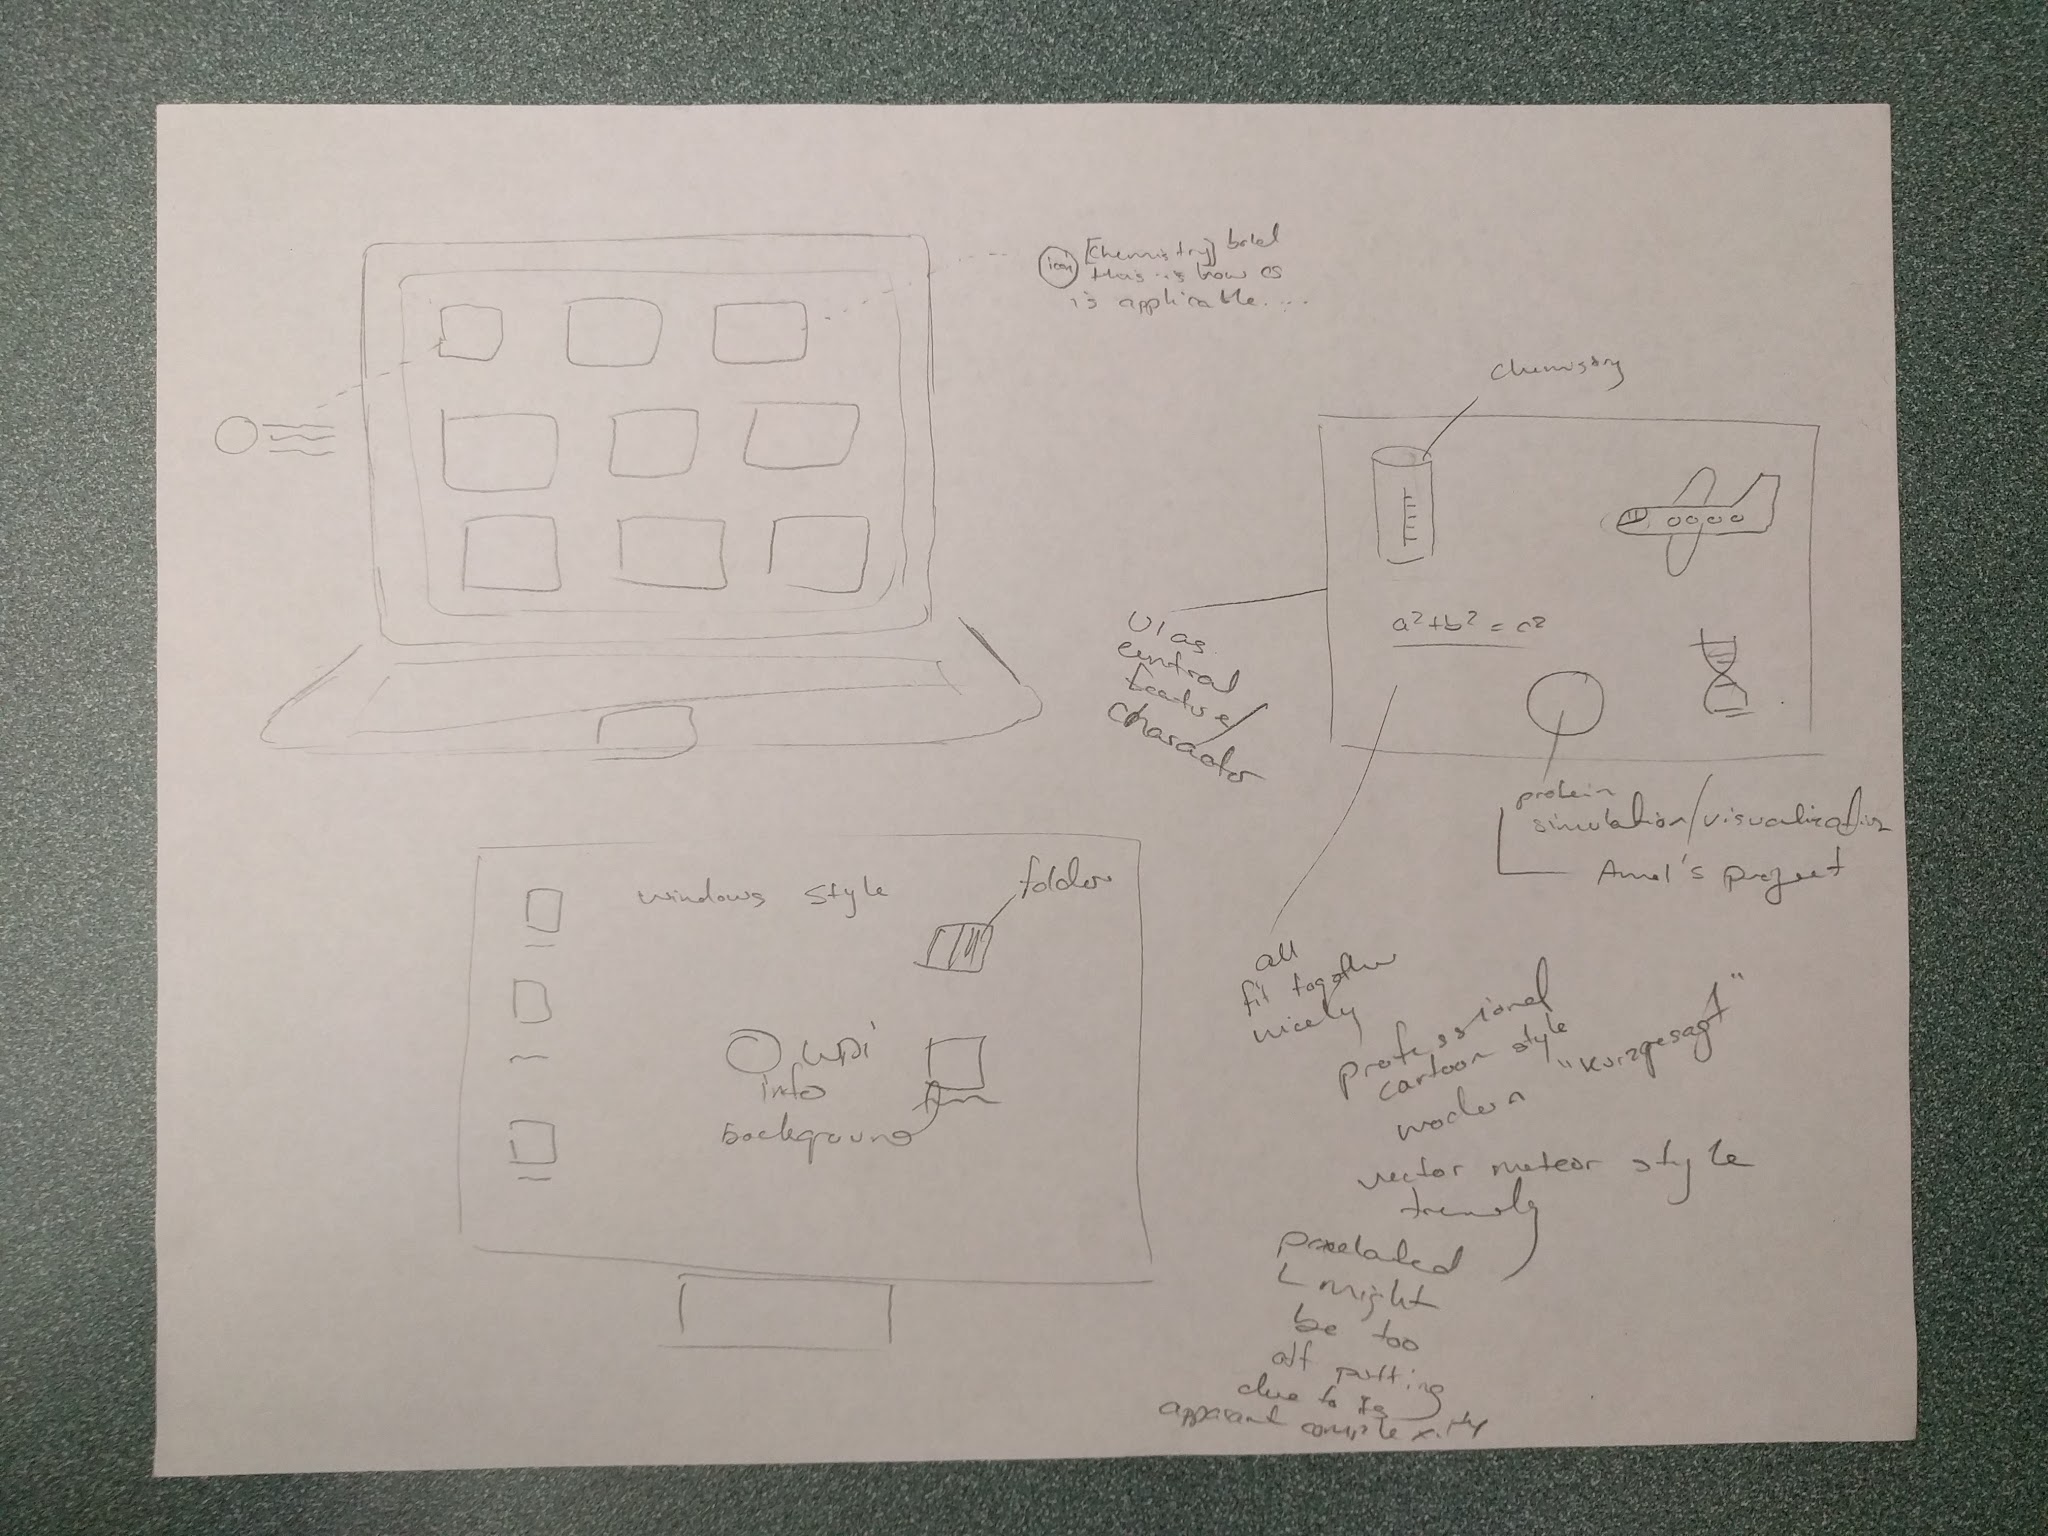
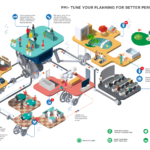
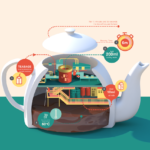
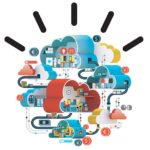
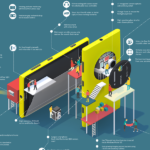
Based on some ideas by Brandon, and after some discussion with Henry, I drafted our ideas on paper. We thought that framing the information graphic in a computer monitor might be a really interesting idea, as if the content was part of the computer itself. We first thought of having a “word cloud” style image, but instead of words, replaced with icons representing the applications of computer science to other fields. However, going off of the idea that the information graphic was part of the computer frame, we also thought of using icons explaining the various applications of computer science to other fields, as if they were computer applications installed on this machine. This idea was slowly abandoned in favor of a more clean and minimalist approach, vaguely resembling the colorful “professional flat cartoon” style that is trendy today,.
I have included a gallery for our inspiration research and infographic ideas:
I found this resource if anyone ever need a pixel map generator, http://pixelmap.amcharts.com/